前提
WSL2
twmeggs/anfis インストールとテスト
以下のモジュールを試してみる。
GitHub - twmeggs/anfis: Python implementation of an Adaptive neuro fuzzy inference system
pip install anfis
で、とりあえず
import anfis
でやってみたけどエラー。
うーーーーーん。
  File "/home/moscow_0_0/test/ANFIS/tests.py", line 1, in <module>
    from anfis import ANFIS
  File "/home/moscow_0_0/.local/lib/python3.10/site-packages/anfis/__init__.py", line 2, in <module>
    from membership import membershipfunction
ModuleNotFoundError: No module named 'membership'
これ、元々のコード自体にバグがある。
バグというか、もしかしたらpythonの新しいバージョンに対応してないとかかも。
gabrielegilardi/ANFIS インストールとテスト
下のようなのも見つけた。
git clone https://github.com/gabrielegilardi/ANFIS.git
でコードをローカルに持ってきて
cd ANFIS/Code_Python
python3 test.py plant
でテスト。
コード修正
Number of samples =  9568
Number of inputs =  4
Number of outputs =  1

Number of training samples =  6697
Number of test samples=  2871

ANFIS layout =  [1, 1, 1, 1]
Number of premise functions =  4
Number of consequent functions =  1
Number of variables =  17

Solution:
J minimum =  47.4403258301235
Best learner =  28
Close learners =  40

Coefficients:
mu =  [-0.5691733  -0.49881146 -0.05413919 -0.73346721]
s  =  [0.43945629 0.53054467 0.56576613 0.39742406]
c  =  [1.7038334  2.29648476 1.57923399 2.02310132]
A =
[[-0.09802496]
 [-0.39228493]
 [-0.07665637]
 [ 0.01094195]
 [-0.06074266]]
Traceback (most recent call last):
  File "/home/moscow_0_0/git/ANFIS/Code_Python/test.py", line 275, in <module>
    utl.plot_mfs(n_mf, mu, s, c, Xn_tr)
  File "/home/moscow_0_0/git/ANFIS/Code_Python/utils.py", line 222, in plot_mfs
    plt.axvline(X_min, lw=1.5, ls='--', C='k')
  File "/home/moscow_0_0/.local/lib/python3.10/site-packages/matplotlib/pyplot.py", line 2716, in axvline
    return gca().axvline(x=x, ymin=ymin, ymax=ymax, **kwargs)
  File "/home/moscow_0_0/.local/lib/python3.10/site-packages/matplotlib/axes/_axes.py", line 852, in axvline
    l = mlines.Line2D([x, x], [ymin, ymax], transform=trans, **kwargs)
  File "/home/moscow_0_0/.local/lib/python3.10/site-packages/matplotlib/lines.py", line 407, in __init__
    self._internal_update(kwargs)
  File "/home/moscow_0_0/.local/lib/python3.10/site-packages/matplotlib/artist.py", line 1219, in _internal_update
    return self._update_props(
  File "/home/moscow_0_0/.local/lib/python3.10/site-packages/matplotlib/artist.py", line 1193, in _update_props
    raise AttributeError(
AttributeError: Line2D.set() got an unexpected keyword argument 'C'
うーん・・・なんとなく、古いmatplotlibにしか対応してないとかかな。
まあ、直してみるか。
以下を見る感じ、引数名をCでなくcかcolorにすれば動きそう。
matplotlib.pyplot.axvline — Matplotlib 3.8.2 documentation
んで、動かしてみたけどまたエラー。
Traceback (most recent call last):
  File "/home/moscow_0_0/git/ANFIS/Code_Python/test.py", line 275, in <module>
    utl.plot_mfs(n_mf, mu, s, c, Xn_tr)
  File "/home/moscow_0_0/git/ANFIS/Code_Python/utils.py", line 226, in plot_mfs
    plt.grid(b=True)
  File "/home/moscow_0_0/.local/lib/python3.10/site-packages/matplotlib/pyplot.py", line 3141, in grid
    gca().grid(visible=visible, which=which, axis=axis, **kwargs)
  File "/home/moscow_0_0/.local/lib/python3.10/site-packages/matplotlib/axes/_base.py", line 3196, in grid
    self.xaxis.grid(visible, which=which, **kwargs)
  File "/home/moscow_0_0/.local/lib/python3.10/site-packages/matplotlib/axis.py", line 1697, in grid
    self.set_tick_params(which='major', **gridkw)
  File "/home/moscow_0_0/.local/lib/python3.10/site-packages/matplotlib/axis.py", line 958, in set_tick_params
    kwtrans = self._translate_tick_params(kwargs)
  File "/home/moscow_0_0/.local/lib/python3.10/site-packages/matplotlib/axis.py", line 1102, in _translate_tick_params
    raise ValueError(
ValueError: keyword grid_b is not recognized; valid keywords are ['size', 'width', 'color', 'tickdir', 'pad', 'labelsize', 'labelcolor', 'labelfontfamily', 'zorder', 'gridOn', 'tick1On', 'tick2On', 'label1On', 'label2On', 'length', 'direction', 'left', 'bottom', 'right', 'top', 'labelleft', 'labelbottom', 'labelright', 'labeltop', 'labelrotation', 'grid_agg_filter', 'grid_alpha', 'grid_animated', 'grid_antialiased', 'grid_clip_box', 'grid_clip_on', 'grid_clip_path', 'grid_color', 'grid_dash_capstyle', 'grid_dash_joinstyle', 'grid_dashes', 'grid_data', 'grid_drawstyle', 'grid_figure', 'grid_fillstyle', 'grid_gapcolor', 'grid_gid', 'grid_in_layout', 'grid_label', 'grid_linestyle', 'grid_linewidth', 'grid_marker', 'grid_markeredgecolor', 'grid_markeredgewidth', 'grid_markerfacecolor', 'grid_markerfacecoloralt', 'grid_markersize', 'grid_markevery', 'grid_mouseover', 'grid_path_effects', 'grid_picker', 'grid_pickradius', 'grid_rasterized', 'grid_sketch_params', 'grid_snap', 'grid_solid_capstyle', 'grid_solid_joinstyle', 'grid_transform', 'grid_url', 'grid_visible', 'grid_xdata', 'grid_ydata', 'grid_zorder', 'grid_aa', 'grid_c', 'grid_ds', 'grid_ls', 'grid_lw', 'grid_mec', 'grid_mew', 'grid_mfc', 'grid_mfcalt', 'grid_ms']
これもgridの引数が変わったのが原因っぽいな。
matplotlib - 目盛、目盛のラベル、グリッドの設定方法について - pystyle
b 引数になにも指定しなかった場合、グリッドの表示/非表示を現在の状態から切り替えます。
True/False: グリッドを表示/非表示にする
None: グリッドの表示/非表示を現在の状態から切り替える
matplotlib.pyplot.grid — Matplotlib 3.8.2 documentation
visible: bool or None, optional
Whether to show the grid lines. If any kwargs are supplied, it is assumed you want the grid on and visible will be set to True.If visible is None and there are no kwargs, this toggles the visibility of the lines.
ってわけで、引数名が「b」が「visible」に変わったらしい。
変わりすぎだろ…w
テスト:plant
python3 test.py plant
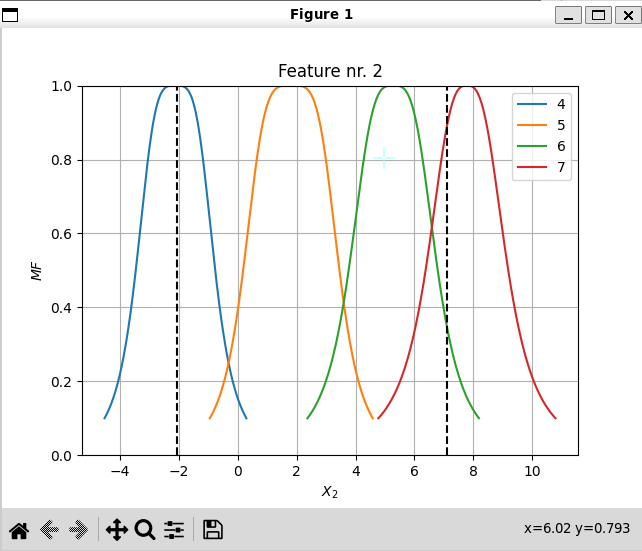
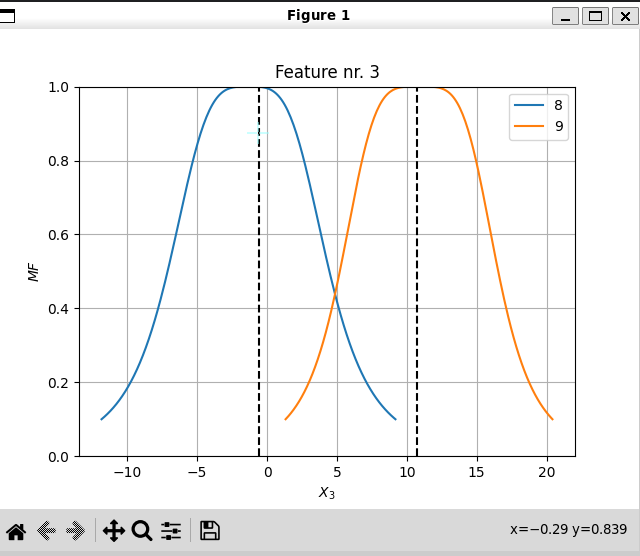
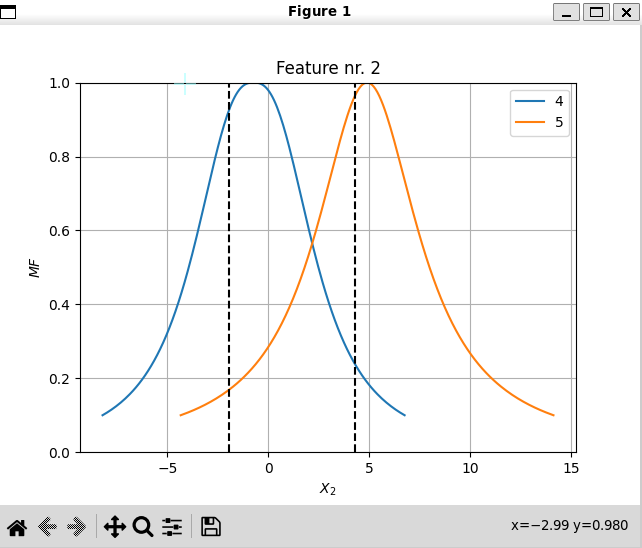
直して上のコードを再実行したら、図が表示された。
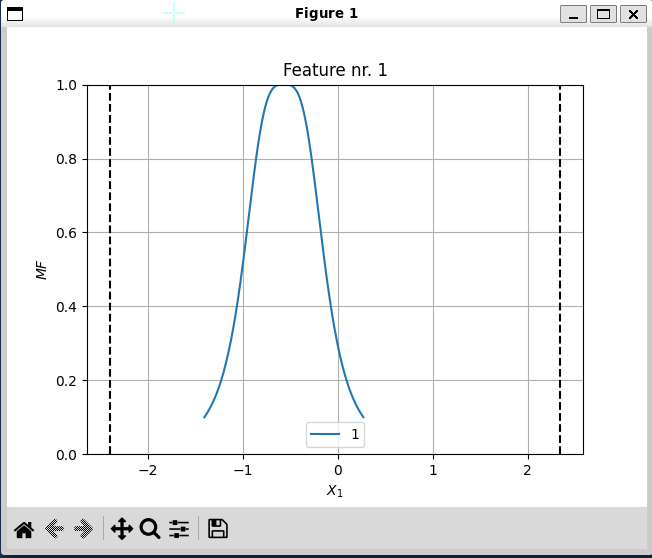
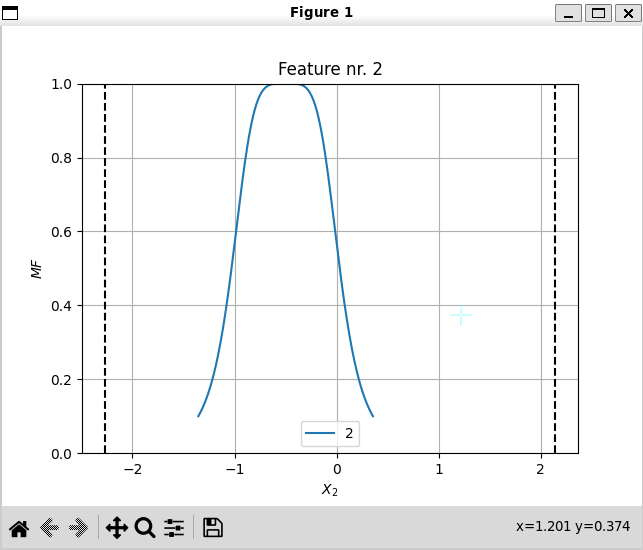

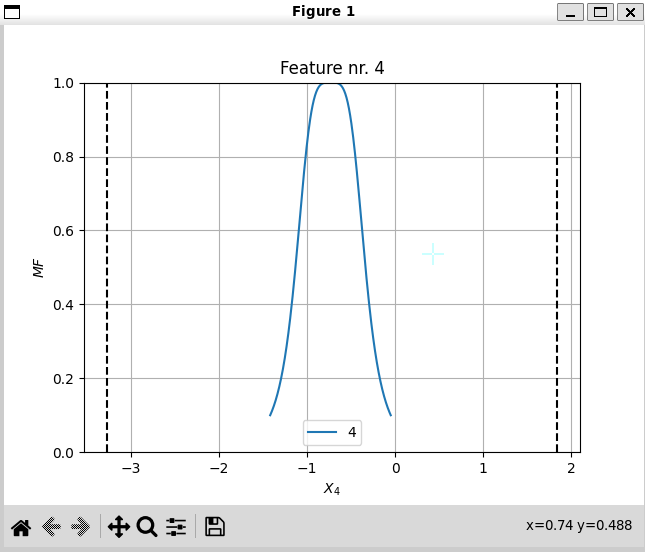
これなに?w
Single-label continuous problem example: plant
Original dataset: https://archive.ics.uci.edu/ml/datasets/Combined+Cycle+Power+Plant.
The dataset has 4 features (inputs), 1 label (output), and 9568 samples.
The ANFIS has a layout of [1, 1, 1, 1] and 17 variables.
Predicted/actual correlation values: 0.965 (training), 0.961 (test).
リンク先のデータセットの説明は以下。
The dataset contains 9568 data points collected from a Combined Cycle Power Plant over 6 years (2006-2011), when the power plant was set to work with full load. Features consist of hourly average ambient variables Temperature (T), Ambient Pressure (AP), Relative Humidity (RH) and Exhaust Vacuum (V) to predict the net hourly electrical energy output (EP) of the plant.
ChatGPT曰く
データセットには、発電所がフルロードで稼働していた期間、つまり6年間(2006年から2011年)にわたり、Combined Cycle Power Plantから収集された9568のデータポイントが含まれています。特徴量には、発電所の純時給電気エネルギー出力(EP)を予測するための時刻ごとの平均環境変数が含まれています。これらの変数には、温度(T)、周囲の気圧(AP)、相対湿度(RH)、および排気真空(V)があります。
うーん。
4つ表示された図は、それぞれの特徴量(入力)と予測値、つまりエネルギー出力の関係を表してるっぽい。
けど、それ以上のことはちょっとよくわからん。
テスト:stock
python3 test.py stock
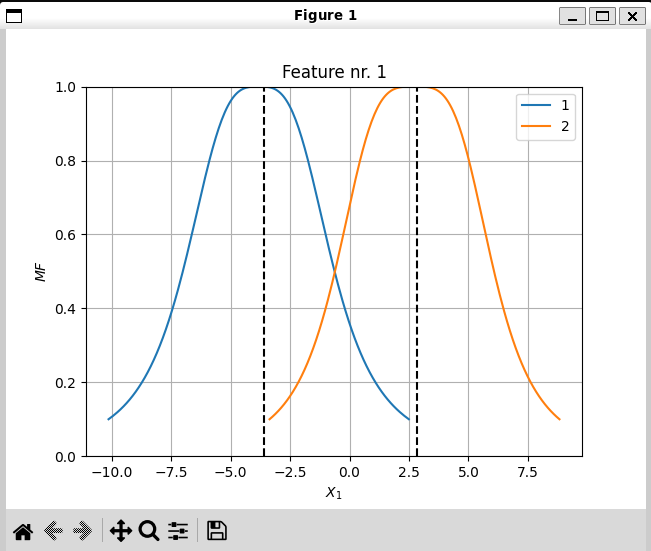

Multi-label continuous problem example: stock
Original dataset: https://archive.ics.uci.edu/ml/datasets/ISTANBUL+STOCK+EXCHANGE.
The dataset has 3 features (inputs), 2 labels (outputs), and 536 samples.
The ANFIS has a layout of [2, 2, 2] and 82 variables.
Predicted/actual correlation values: 0.883 (training), 0.871 (test).
Data sets includes returns of Istanbul Stock Exchange with seven other international index; SP, DAX, FTSE, NIKKEI, BOVESPA, MSCE_EU, MSCI_EM from Jun 5, 2009 to Feb 22, 2011.
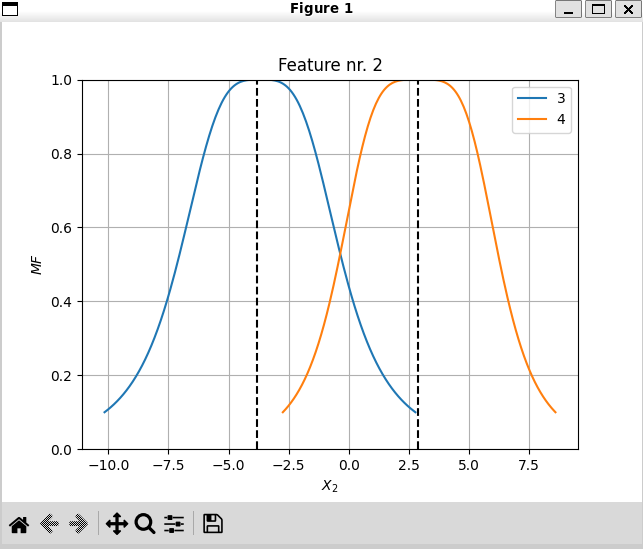
こちらも、3つの特徴量から2つの値を予測しようとしてる、ということは分かるが…
CSVにはヘッダが無いし、元のExcelデータはこんな感じ。
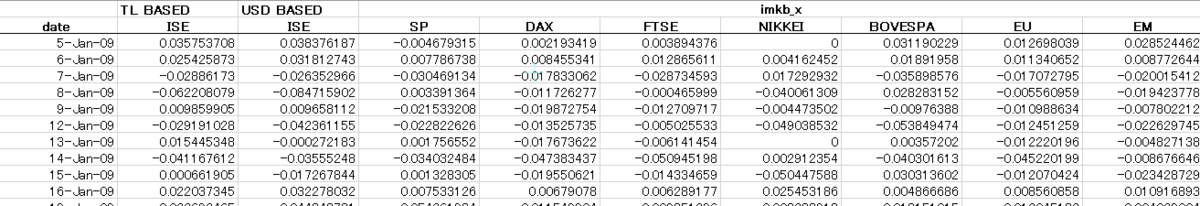
S&P 500やDAX、FTSEからイスタンブール取引所の利益を予測しようとしてる、ということなのかな。
そうだとするとイスタンブール取引所の利益はトルコリラベースと米ドルベースでスケールを合わせたら完全に同じ値になるので、2つの値を予測する意味はないね。
テスト:wine
python3 test.py wine
Multi-class classification problem example: wine
Original dataset: https://archive.ics.uci.edu/ml/datasets/Wine+Quality.
The dataset has 2 features (inputs), 6 classes (outputs), and 1599 samples.
The ANFIS has a layout of [3, 2] and 123 variables.
Predicted/actual accuracy values: 58.2% (training), 59.8% (test).

これは分かりやすい。
まあワインのことはよく分からんが、2つの特徴量から6クラス分類を行っている。
テスト:pulsar
python3 test.py pulsar
Multi-class classification problem example: pulsar
Original dataset: https://archive.ics.uci.edu/ml/datasets/HTRU2.
The dataset has 3 features (inputs), 2 classes (outputs), and 17898 samples.
The ANFIS has a layout of [3, 4, 2] and 219 variables.
Predicted/actual accuracy values: 97.9% (training), 97.7% (test).
これも分類問題で、3特徴量から2クラスの分類を行っている。
パルサーという天体があるらしい。