元ネタ
CNN-LSTMモデルを用いた株式相場予想 #Python - Qiita
ソースコード
forecast_sp500/cnn_lstm.ipynb at main · sugiyama404/forecast_sp500 · GitHub
git clone https://github.com/sugiyama404/forecast_sp500.git
cd forecast_sp500/
python3 -m venv venv
source venv/bin/activate
pip install --upgrade pip
pip install numpy
pip install pyarrow
pip install pandas
pip install matplotlib
pip install scikit-learn
pip install tensorflow[and-cuda]
Kerasはtensorflowに統合されたので、tensoflowで代替。GPUを使いたいのでcudaも入れる。
tensorflowについては以下に従う。
Install TensorFlow with pip
python3 -c "import tensorflow as tf; print(tf.config.list_physical_devices('GPU'))"
Kerasについては微妙にバージョン差異で合っていないので修正する。
from keras.models import Sequential
from keras.layers import Dense, Activation
from keras.layers import LSTM,GRU
元のNotebookではGoogle Driveに保管する前提になっている箇所があるので、データはyfinanceで取ってくるようにする。
pip install yfinance
import yfinance as yf
ticker = yf.Ticker("^GSPC")
def get_data(yf_start, yf_end):
    global ticker
    yf_data = ticker.history(interval="1d", start=yf_start, end=yf_end)
    data = pd.DataFrame()
    data['SP500'] = yf_data['Close']
    data['Date'] = yf_data.index
    return data

tr_start="2015-1-1"
tr_end="2017-6-30"
df_train = get_data(tr_start, tr_end)

ts_start="2017-7-1"
ts_end="2021-1-1"
df_test = get_data(tr_start, ts_end)
後は流すだけだ。
結果はこう。

一部を拡大するとこんな感じ。
前後と上下に微妙にずれがある。
上下はまあスケーラーの問題っぽいとして、前後にずれているので予測能力はなさそうだ。

アウトプットの形式が(N, 10, 1)となっているのが気になる。
元ネタ論文の
元ネタの論文は以下。
https://www.hindawi.com/journals/complexity/2020/6622927/
元論文でもほとんど予測能力が無いように見えるが、元データとMAE、RMSEを比較してみることにする。
元ネタの論文と異なる点として、
- 対象データが異なる。(論文より少ない)
- モデルのノード数が異なる(論文より簡素なものになっている)
論文では9年間のデータを用い、過去10日間の始値、高値、安値、終値、出来高、ターンオーバー、増減量、増減率から翌日の終値を予測する。
According to the influence factors, including the opening price, highest price, lowest price, closing price, volume, turnover, ups and downs, and change, the next day’s closing price is predicted.
In this experiment, the Shanghai Composite Index (000001) is selected as the experimental data. The daily trading data of 7127 trading days from July 1, 1991, to August 31, 2020, are obtained from the wind database. Each piece of data contains eight items, namely, opening price, highest price, lowest price, closing price, volume, turnover, ups and downs, and change.
Take the data of the first 6627 trading days as training set and the data of the last 500 trading days as test set.
上海総合指数(000001.SS)の2020/8/31までの500日分のデータを確認する。
import pandas as pd
import yfinance as yf
ticker = yf.Ticker("000001.SS")
def get_data(yf_start, yf_end):
    global ticker
    return ticker.history(interval="1d", start=yf_start, end=yf_end)

tr_start="1991-06-01"
tr_end="2020-08-31"
df= get_data(tr_start, tr_end)

target_data = df.iloc[-500:]['Close']
target_data
target_data = df.iloc[-500:]['Close']
target_data
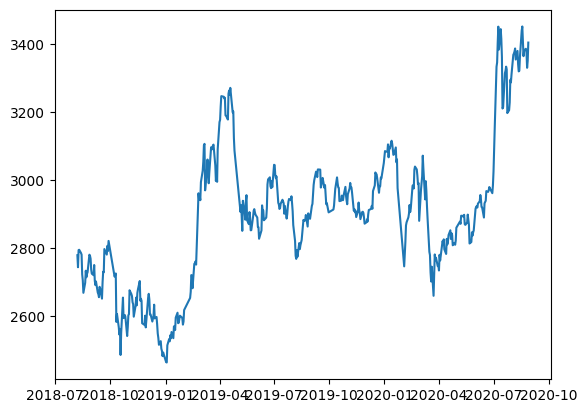
論文中のグラフと一致しており、データに間違いは無さそう。

next_data = target_data.shift(-1)
diff_series = next_data - target_data
diff_series.dropna(inplace=True)
print(((diff_series**2).mean())**0.5)
print(abs(diff_series).mean())
ここでやりたいことは前項をそのまま予測値として出力する(つまり予測能力ゼロの)モデルを考え、このモデルのRMSEとMAEを論文のものと比較したい。
RMSEが38.26599652578166
MAEが26.218838556018287
となる。
論文では最良のRMSEが39、MAEが27であり、予測能力は無いと言っていいだろう。